PC game performance profiling isn’t what it used to be. In the DirectX 12 and Vulkan era, a “frame” is often the end result of asynchronous compute, hardware ray tracing, temporal reconstruction, frame generation, and machine learning-powered denoising and upscaling. With so many moving parts, basic FPS counters and overlay graphs can’t tell you where time is really going. To get real answers, you need a profiler that can show how work is scheduled across the GPU, how queues overlap (or don’t), and which shaders or pipeline stages are actually limiting performance. That’s exactly the kind of job NVIDIA Nsight Graphics is built for.
This guide walks through a practical, game-focused workflow for profiling GPU performance using NVIDIA Nsight Graphics, with Cyberpunk 2077 as the case study. The goal here isn’t to debug rendering glitches or visual correctness. It’s to understand performance: what the GPU is doing each frame, what changes when you move from rasterized rendering to heavier ray/path-traced workloads, and how features like GPU Trace, Shader Pipelines, and Hotspots help you pinpoint why performance rises or falls. The approach is grounded in NVIDIA’s Peak-Performance-Percentage (PPA) methodology, which starts from hard GPU evidence instead of assumptions about what the engine “must” be doing.
NVIDIA Nsight Graphics, explained for performance profiling
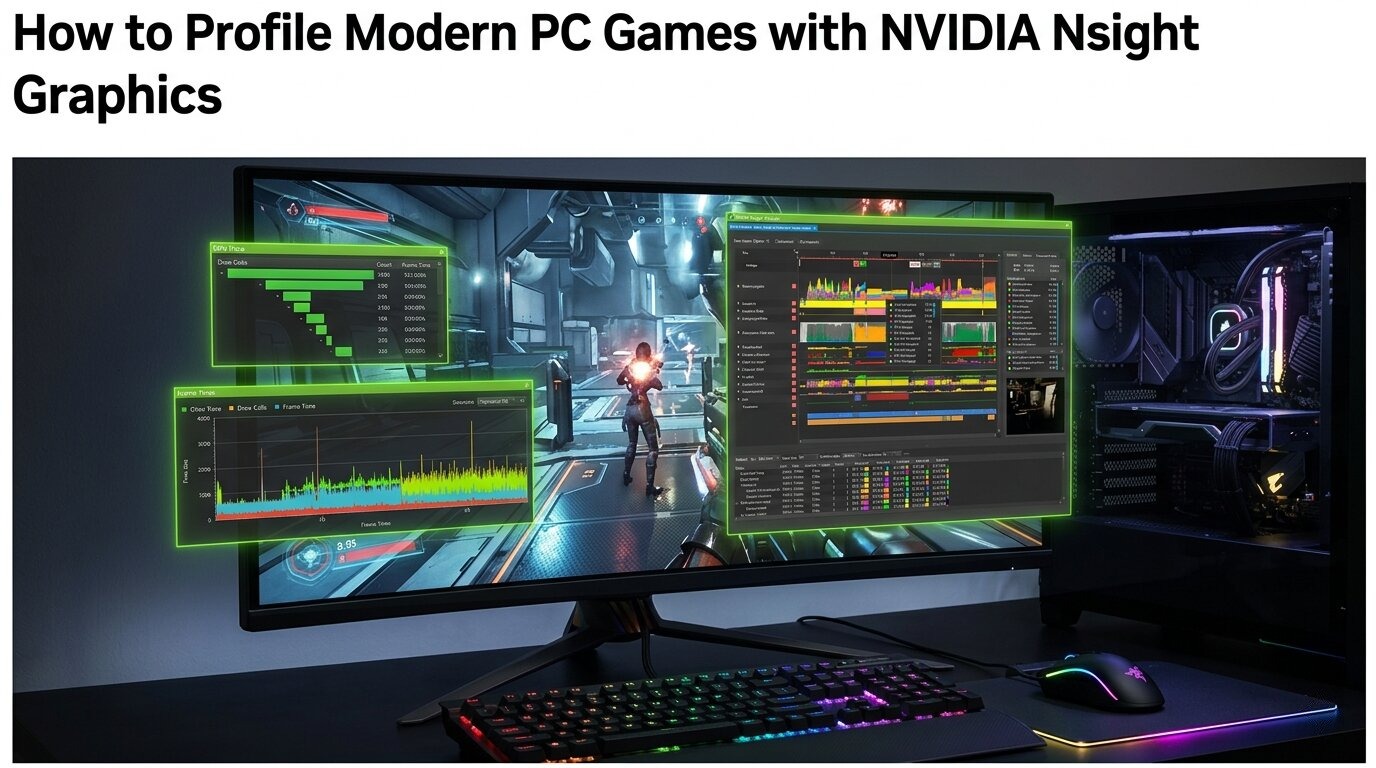
NVIDIA Nsight Graphics is a graphics debugger and profiler designed for modern graphics APIs like Direct3D 12 and Vulkan. It includes multiple analysis modes, but if your mission is performance, the star of the show is GPU Trace. GPU Trace captures a detailed view of how the GPU executes work over a frame (or a short sequence of frames), including queue activity, synchronization points, timing breakdowns, and shader-level behavior.
This distinction matters because different tools inside Nsight are meant for different jobs. A “graphics capture” is great when you want to freeze a frame and inspect render targets, resources, pipeline state, or draw calls. GPU Trace is the mode you use when the question is: “Why is my frame time this high?” It exposes what’s happening on the graphics/direct queue, compute queue, and copy queue, and it helps you see whether you’re limited by things like occupancy, memory throughput, divergence, or a lack of overlap between graphics and compute work.
Recent versions of Nsight Graphics have also become much more relevant to modern PC game profiling. The Shader Profiler now includes a Flame Graph for easier “where is the time going?” investigation, and in Direct3D 12 workloads Nsight can show NGX-created work, including tasks associated with NVIDIA DLSS and related SDK features. In real-world terms, that means the tool is far better equipped to analyze titles using ray tracing plus machine learning-assisted reconstruction and denoising.
There are other widely used graphics analysis tools in the PC ecosystem, and they’re valuable in their own ways. But if you’re profiling a game on an NVIDIA GPU and want the deepest access to NVIDIA-specific metrics and execution detail, Nsight Graphics is often the most capable option for answering performance questions with confidence.
The profiling mindset: Peak-Performance-Percentage (PPA) analysis
A common mistake in performance discussions is starting with a guess. Ray tracing is enabled, so ray tracing “must” be the bottleneck. A post-processing chain looks intense, so post-processing “must” be the problem. The PPA approach flips that around: it begins by measuring GPU behavior, then uses utilization and throughput data to identify what’s truly limiting the frame.
The core loop looks like this:
1) Identify the expensive workload (the part of the frame where time is clearly being spent).
2) Check high-level throughput and utilization metrics to see which GPU units are closest to their theoretical limits (often described as Speed Of Light, or SOL).
3) If no unit is near saturation (NVIDIA’s PPA guidance uses >80% SOL as a key threshold), the problem is often poor utilization or insufficient parallelism.
4) If one unit is near its limit, optimization usually means reducing pressure on that unit or restructuring work so the bottleneck shifts.
This is a disciplined way to profile because it’s based on what the GPU is actually doing rather than what the scene looks like.
In Nsight Graphics, the PPA workflow maps cleanly to the interface:
– GPU Trace gives you the timeline view, queue overlap, synchronization, and frame structure.
– Top-Level Triage helps you quickly categorize what kind of bound you’re seeing.
– Shader Pipelines helps you find the most expensive shader workloads in a selected range.
– Hotspots and Shader Profiler views help explain why those shaders cost so much, such as control-flow divergence, memory dependencies, instruction mix, or simply massive workload size.
Test setup and capture strategy (Cyberpunk 2077)
To keep the analysis meaningful, the workflow uses two captures from the same in-game scene at 2560×1440 (1440p), but with two very different rendering scenarios. That makes it easier to see how the GPU workload changes as rendering complexity ramps up.
Test system:
CPU: Intel Core i7-14700K
RAM: 32 GB DDR5-7000 CL34
Storage: 2 TB PCIe 4.0 NVMe SSD
GPU: NVIDIA GeForce RTX 4090 24 GB
OS: Windows 11 25H2
All firmware, drivers, BIOS, and OS updates applied prior to testing.
Capture scenarios:
1) High graphics preset with raster-only settings
2) High graphics preset with path tracing (RT Overdrive) plus DLSS Ray Reconstruction in Quality mode (machine learning-assisted denoising and upscaling for path-traced effects)
This pairing is useful because the first trace represents a more traditional raster pipeline workload, while the second adds a much heavier path-traced workload and introduces additional ML-driven reconstruction work that changes where GPU time is spent.
How to profile a game with NVIDIA Nsight Graphics (practical workflow)
The actual process is straightforward once you know the key switches that prevent common “why isn’t this working?” issues.
Step 1: Enable GPU performance counters access
Open the NVIDIA App, then go to System → Advanced and set Manage GPU Performance Counters to All users. This allows Nsight Graphics to access GPU performance counters without requiring Administrator privileges.
Step 2: Create a new Nsight Graphics project
Launch Nsight Graphics, then create a new project from File → New Project. This keeps your capture setup organized and repeatable.
Step 3: Launch the game through Nsight with GPU Trace
In the Start Activity / capture settings:
– Choose GPU Trace Profiler (this is the performance analysis mode, not the graphics debugging mode).
– Point Application Executable directly to the game’s actual executable path, not a launcher. Launchers can interfere with attachment and can complicate capture stability.
– For Timeline Metrics, select Top-Level Triage.
– Enable Real-Time Shader Profiler.
From there, you capture the frame or frame range you want, then use the GPU Trace timeline to identify where the frame time goes, confirm whether the GPU is truly the limiting factor, and drill into the most expensive workloads using Shader Pipelines and Hotspots. This is where the PPA mindset pays off: instead of guessing “path tracing is slow,” you can see exactly which queues, passes, and shaders dominate the frame, how much overlap is happening, and whether the limiting factor is compute pressure, memory behavior, divergence, or something else.
If you share the rest of the capture settings text after “Leave” (your provided content cuts off mid-step), I can complete that section in the same style while keeping the original intent intact.With advanced capture options such as Multi-Pass Metrics turned off, you get a cleaner, more reliable GPU Trace capture. These settings are still enough to collect what matters most for real-world performance analysis: high-level GPU utilization plus shader-level profiling data that reveals where frame time is actually being spent.
Next, launch the game directly through NVIDIA Nsight Graphics using the Launch button in the bottom-right corner. This is important because Nsight needs to inject into the process to monitor GPU activity live and prepare for an accurate capture.
Once the game is running, move to a stable test scene before you record anything. Pick an area that represents typical gameplay—like a dense city street in an open-world game—then stop moving the camera. Give it a few seconds so shader compilation can finish and the GPU workload can settle into a consistent pattern. When Nsight is ready, you’ll see the overlay/menu in the top-left showing a status like “Data Collection: Ready,” along with the capture hotkey.
To capture a frame, press F11 (the default hotkey). Nsight Graphics will record timestamps, GPU metrics, and shader execution behavior, then assemble a detailed timeline of what happened during that frame. After the capture, Alt+Tab back to Nsight Graphics, where the captured frame appears in its own window. From there you can rename it and open it as a full GPU Trace report.
Inside the GPU Trace report, the main Timeline view is where the real work begins. You’ll see a breakdown across the graphics queue and compute queue, plus per-unit utilization data, shader pipeline summaries, hotspots, and flame graph-style views that make it easier to spot expensive regions. GPU Trace uses timing data to show the duration of draw calls, compute dispatches, synchronization barriers, and memory events—exactly the kind of detail you need when a frame “feels slow” but the reason isn’t obvious.
To show what this method looks like in a practical game-performance investigation, two GPU traces were captured from Cyberpunk 2077 using Nsight Graphics’ GPU Trace Profiler. The first trace focuses on a traditional rasterized workload at 1440p using the High preset with ray tracing disabled, creating a baseline view of how a modern AAA engine (CD Projekt Red’s REDengine 4) builds a frame. The second trace uses the game’s most demanding rendering path: path tracing (RT Overdrive) combined with DLSS Ray Reconstruction set to Quality. Comparing these two scenarios makes it easier to see how GPU workload complexity scales as advanced ray tracing and AI-assisted rendering techniques come into play, and how Nsight exposes the shift from classic raster pipelines toward hybrid compute and ray tracing driven rendering.
One important caveat: this analysis was done on the retail version of the game, not a developer or instrumented build. That means there were no internal performance markers labeling specific render passes (such as G-buffer, ambient occlusion, reflections, tone mapping, or post-processing). When games provide those markers, Nsight can display them and make the frame structure much easier to interpret. Without them, the analysis relies on GPU Trace timing, Shader Pipelines data, and Hotspots to infer what the major workload regions likely represent and where the bottlenecks live.
Rasterized frame trace: 1440p High, no ray tracing
To understand what limits a “raster-only” frame on modern GPUs, a single frame was captured from Cyberpunk 2077 at 1440p High with all ray-traced effects turned off. Many people assume this kind of workload is primarily about geometry throughput and pixel shading. The Nsight trace quickly shows it’s more complicated than that.
By combining the GPU Trace timeline with queue-level behavior (including heavy async compute usage), the frame can be reconstructed into several broad regions. Even without explicit labels, the structure is still recognizable: early setup work (such as depth and shadows), a draw-heavy main geometry/G-buffer phase, then larger late-frame processing stages that include lighting, indirect lighting, screen-space effects, temporal anti-aliasing, post-processing, and finally UI/HUD rendering.
The standout observation is that the frame is heavily back-loaded. The single largest region occurs late in the frame and accounts for roughly 48.5% of total queued GPU time. That section is not dominated by draw calls. Instead, it contains dense compute dispatches, synchronization barriers, and memory-related operations.
In plain terms, the most expensive part of this rasterized frame isn’t “drawing the world.” It’s the lighting and related processing that happens after the geometry is already on the screen. That aligns with how most modern AAA engines operate, since deferred rendering pushes a large portion of lighting and screen-space work into later stages that are frequently compute-driven.
Shader Pipelines data (DXIL) reinforces the same conclusion. Across the frame, compute shaders account for about 68.8% of total samples, pixel shaders around 26.6%, and vertex shaders roughly 3.7%. Even more revealing, a single compute shader represents nearly 29.8% of all samples by itself, making it the dominant cost. That’s a major clue: this “raster” workload is actually being shaped by compute-heavy lighting and post-geometry processing, not by classic vertex/pixel bottlenecks.
Hotspot analysis explains why that top compute shader is expensive. The heaviest concentration is around sampleLevel texture fetches and other memory-dependent instructions. The main stall reasons reported include Long Scoreboard (warps waiting on memory/texture dependencies) and TEX Throttle (pressure and saturation in the texture sampling pipeline). This is a critical distinction for optimization: the shader isn’t slow because it’s doing too much arithmetic—it’s slow because it’s frequently waiting for data.
Trace Analysis highlights the same pattern at a higher level, listing issues such as L2 Limited, Warp Stalled by L1TEX Long Scoreboard, and Warp Stalled by TEX Throttle. Taken together, this aligns with NVIDIA’s peak performance style diagnosis of a memory-subsystem-limited workload: heavy demand on L2 cache, stalls caused by memory/texture latency, and texture pipeline saturation tied to the L1/texture path on each SM.
The bigger takeaway is that “raster performance” in modern games often doesn’t behave the way people expect. Even with ray tracing disabled, a large chunk of frame time can be dominated by compute-driven lighting, screen-space effects, and memory/texture bottlenecks rather than raw geometry throughput. Nsight Graphics makes that visible by connecting timeline cost, shader sampling distribution, and stall reasons into one coherent picture—exactly what you need to move from guessing to knowing.For a long time, GPU performance discussions have leaned on simple numbers like teraflops, compute units, and raw memory bandwidth. But modern game rendering has made those headline specs far less reliable at predicting real-world frame time. Even in a fully rasterized frame, “shader math” isn’t the whole story anymore.
In practice, a huge portion of total GPU time happens after geometry submission. Today’s frames are dominated by compute-driven lighting and post/lighting-adjacent workloads, and performance is often dictated by data movement: cache behavior, memory latency, data locality, and how well the GPU keeps its warps fed with the data they need. That’s why a graphics card can look incredible on paper yet fall short in demanding games if its shaders spend too much time waiting on memory or texture fetches.
This is also reflected in NVIDIA’s profiling guidance: stalls such as Long Scoreboard commonly point to the GPU waiting on memory operations rather than lacking compute throughput. In other words, the bottleneck isn’t always “not enough compute,” but “not enough data arriving on time.” In a Cyberpunk 2077 frame capture, that exact problem showed up clearly: theoretical throughput wasn’t the limiter—data starvation was.
Path tracing makes this even more obvious.
When switching from rasterization to path tracing (with DLSS Ray Reconstruction in Quality mode), the captured frame cost rose from about 5.9 ms to around 11 ms. That extra time isn’t just “because ray tracing is on.” Path tracing reshapes the entire frame into a hybrid pipeline where classic raster work, ray traversal (ray/box and ray/triangle operations), and heavy compute-based temporal reconstruction and denoising are woven tightly together.
A path-traced frame includes many compute shader dispatches and DirectX Raytracing (DXR) calls via DispatchRays, but the interesting part is where the time actually goes. Even with explicit ray dispatches present, shader pipeline and hotspot analysis show that the frame remains overwhelmingly compute-driven, with most shader time concentrated in lighting processing, temporal reconstruction, and denoising. The most expensive shaders are still compute shaders using 2D workgroup layouts—strong evidence that a large share of path tracing cost is tied to filtering, denoising, and assembling the final image, not only tracing rays.
Trace analysis highlights the deeper limiter: the frame is primarily constrained by the L2 cache and memory path. Stall reasons like Long Scoreboard and TEX Throttle dominate, meaning warps frequently pause while waiting for data from the cache/memory subsystem. The takeaway is blunt: the main constraint isn’t pure RT-core intersection throughput, but how efficiently the GPU can move and reuse data through its memory hierarchy.
That leads to an important real-world implication for ray tracing and path tracing performance: it doesn’t scale linearly with RT-core speed. Even if ray/triangle throughput doubled, performance would still be held back by cache locality, memory latency, bandwidth pressure, and shader divergence. Path tracing is as much a data movement problem as it is a ray traversal problem.
All of this is why deep profiling matters. NVIDIA Nsight Graphics stands out as a powerful tool for serious NVIDIA GPU performance analysis in modern DirectX 12 and Vulkan games, and its GPU Trace workflow is central to understanding what a single expensive frame is really doing. It provides a hardware-centric view of the frame, reveals GPU queue activity and synchronization, and—when Real-Time Shader Profiling is enabled—opens up shader pipelines, hotspots, and even code-level inspection at the intermediate representation level through DXIL.
The most valuable lesson is methodological: meaningful performance work starts with triage, not assumptions. Capture a stable, repeatable scene. Start with the top-level timeline. Identify which workloads dominate frame time. Only then drill into shader-level evidence to confirm what’s truly expensive and why. That approach matches NVIDIA’s Peak-Performance-Percentage style of analysis and remains a strong foundation for explaining where time is going before attempting fixes.
Cyberpunk 2077 is an ideal case study because it spans the full spectrum of modern rendering—from classic rasterization, to hybrid ray tracing, to full path tracing—while adding machine learning-based temporal upscaling and denoising on top. With the right tooling and workflow, those shifts stop being guesswork based on FPS drops and become clear, measurable changes in GPU behavior. And that’s the real value of advanced profiling: it replaces speculation with evidence, showing exactly why a frame is expensive and what’s actually holding performance back.