Microsoft DirectX Dump Files Enter Public Preview to Simplify GPU Crash Debugging
Microsoft has introduced DirectX Dump Files in public preview, giving game developers and graphics engineers a new tool designed to make GPU crash debugging faster, clearer, and more practical.
GPU crashes have long been one of the most difficult issues for game developers to diagnose. A single crash can depend on many variables, including the graphics card model, driver version, operating system build, game engine behavior, and even specific rendering workloads. Reproducing the same crash consistently can be just as frustrating, especially when it only happens on certain hardware configurations.
DirectX Dump Files aim to solve that problem by capturing important GPU crash data at the moment a failure occurs. Instead of developers having to rely on limited crash reports or user descriptions, the new system packages critical information into a dedicated dump file that can be inspected with Microsoft’s PIX performance and debugging tool.
Microsoft has been building this feature as a cross-vendor GPU debugging solution. The company has worked with AMD, Intel, Nvidia, and Qualcomm on driver compatibility, while also updating the DirectX runtime, Windows graphics kernel, and PIX toolchain to support the new workflow.
How Microsoft DirectX Dump Files work
When a GPU crash occurs, DirectX Dump Files create a snapshot of the GPU execution state at that exact moment. This can include information such as GPU state, driver data, Direct3D runtime context, and software-level details from the application.
The captured data is stored in a single .dxdmp file, which developers can open and analyze in PIX. This gives teams a much better view of what was happening on the GPU when the crash occurred.
However, the quality and depth of the dump file depends on driver support. If a GPU vendor’s driver fully supports DirectX Dump Files, developers can access more complete hardware-specific information, including GPU state and driver-level details. Without full driver support, the dump file still works, but it provides a more limited view.
Three operating modes for different debugging needs
Microsoft has created three operating modes for DirectX Dump Files, allowing developers to choose between performance impact and the amount of crash data collected.
NO_OVERHEAD mode is designed to have little to no runtime performance cost. It captures a snapshot when the crash happens, but the amount of information collected is limited.
MEDIUM_OVERHEAD mode offers a balance between performance and detail. It gathers more data than NO_OVERHEAD mode while keeping runtime impact more manageable.
HIGH_OVERHEAD mode collects the most detailed GPU and driver state data. This mode is the most demanding, but it gives developers the richest information for deep crash analysis.
These modes are important because different development stages require different levels of debugging. A studio may use lighter telemetry during broader testing, then switch to a more detailed mode when trying to investigate a stubborn crash.
Not ready for retail games yet
DirectX Dump Files are currently available as a preview feature and are not intended for use in retail games. For now, the goal is to let developers experiment with the technology and give GPU vendors time to prepare compatible drivers.
Access to the Dump Files Agility SDK is limited to Developer Mode during the preview period. Microsoft expects retail support for DirectX Dump Files to arrive around fall 2026.
That timeline gives engine developers, game studios, and GPU vendors time to test the feature, refine support, and integrate it into future debugging pipelines.
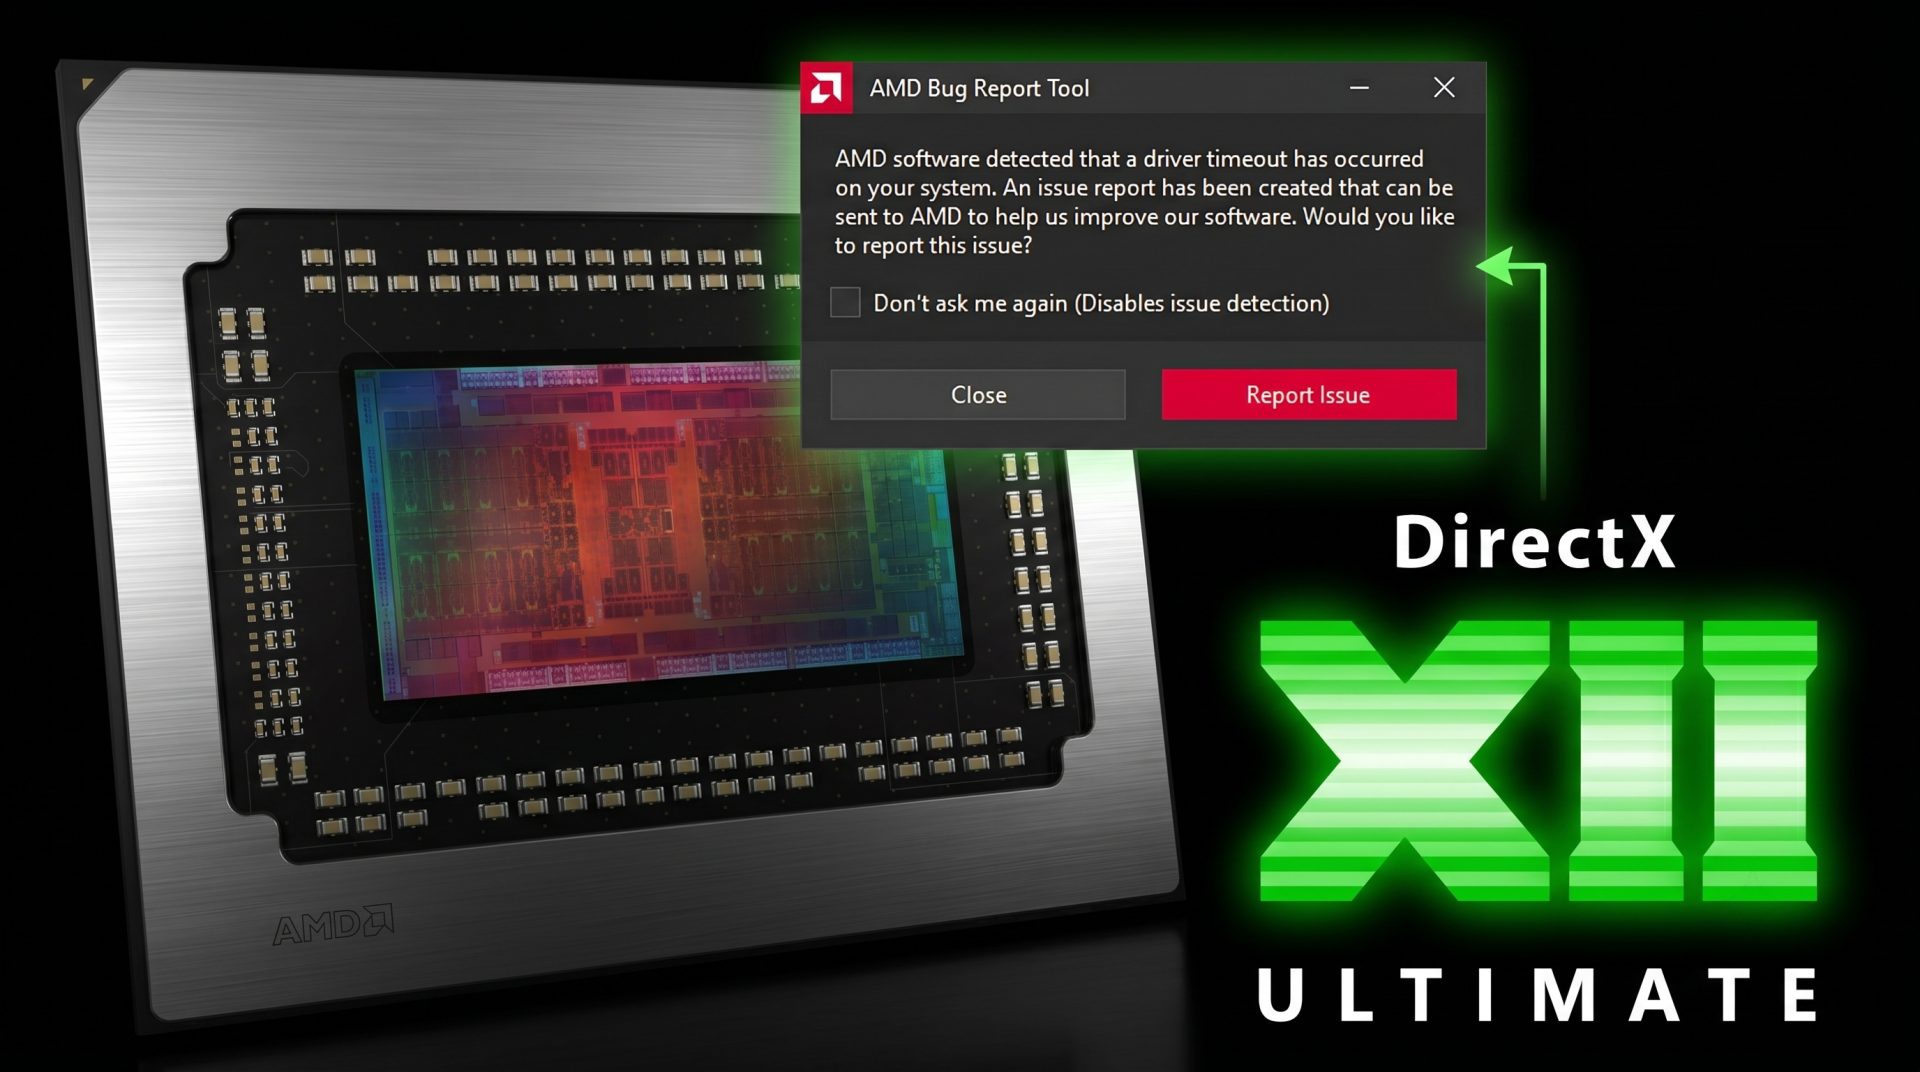
AMD is first with public preview driver support
AMD is the first GPU vendor to publicly support DirectX Dump Files through its Agility SDK Developer Preview Driver 26.10.07.02.
The preview driver enables DirectX Dump Files support on Radeon RX 9000 and RX 7000 series graphics cards. At this stage, AMD’s public implementation supports HIGH_OVERHEAD mode, meaning developers can collect detailed GPU and driver state data for debugging.
AMD’s support also appears to include key DirectX Dump Files features such as extended PIX markers and DebugBreak functionality. Extended PIX markers allow developers to add application-specific context to GPU crash reports, making it easier to understand what the game or engine was doing when the crash happened. DebugBreak allows a dump file to be created when a shader encounters an unexpected condition.
Nvidia, Intel, and Qualcomm preview drivers are not publicly available yet
Although AMD is the first to release public preview support, Microsoft’s broader plan involves all major GPU vendors. AMD, Intel, Nvidia, and Qualcomm have all been part of the cross-vendor effort behind DirectX Dump Files.
At the moment, Nvidia, Intel, and Qualcomm do not appear to have publicly available preview drivers for this feature. Support may arrive later through developer preview drivers or be integrated into future main driver releases.
Why DirectX Dump Files matter for PC gaming
DirectX Dump Files could become a major improvement for PC game stability. Modern games are more complex than ever, with advanced rendering techniques, ray tracing, upscaling technologies, heavy shader workloads, and a wide range of supported hardware. When something goes wrong on the GPU side, developers need precise information to fix the issue efficiently.
By giving developers a clearer snapshot of the GPU crash state, DirectX Dump Files can help reduce guesswork. This may lead to faster bug fixes, better driver collaboration, improved game patches, and more stable performance for players.
For now, the feature is aimed at developers, not everyday gamers. But once retail support arrives, DirectX Dump Files could become an important part of the DirectX development ecosystem, helping studios track down GPU-related crashes that were previously difficult or nearly impossible to diagnose.
Microsoft’s new DirectX Dump Files system is still in preview, but it represents a promising step forward for GPU crash debugging on Windows. With AMD already offering public preview driver support and other vendors expected to follow, developers are getting an early look at a tool that could make future PC games more reliable and easier to troubleshoot.