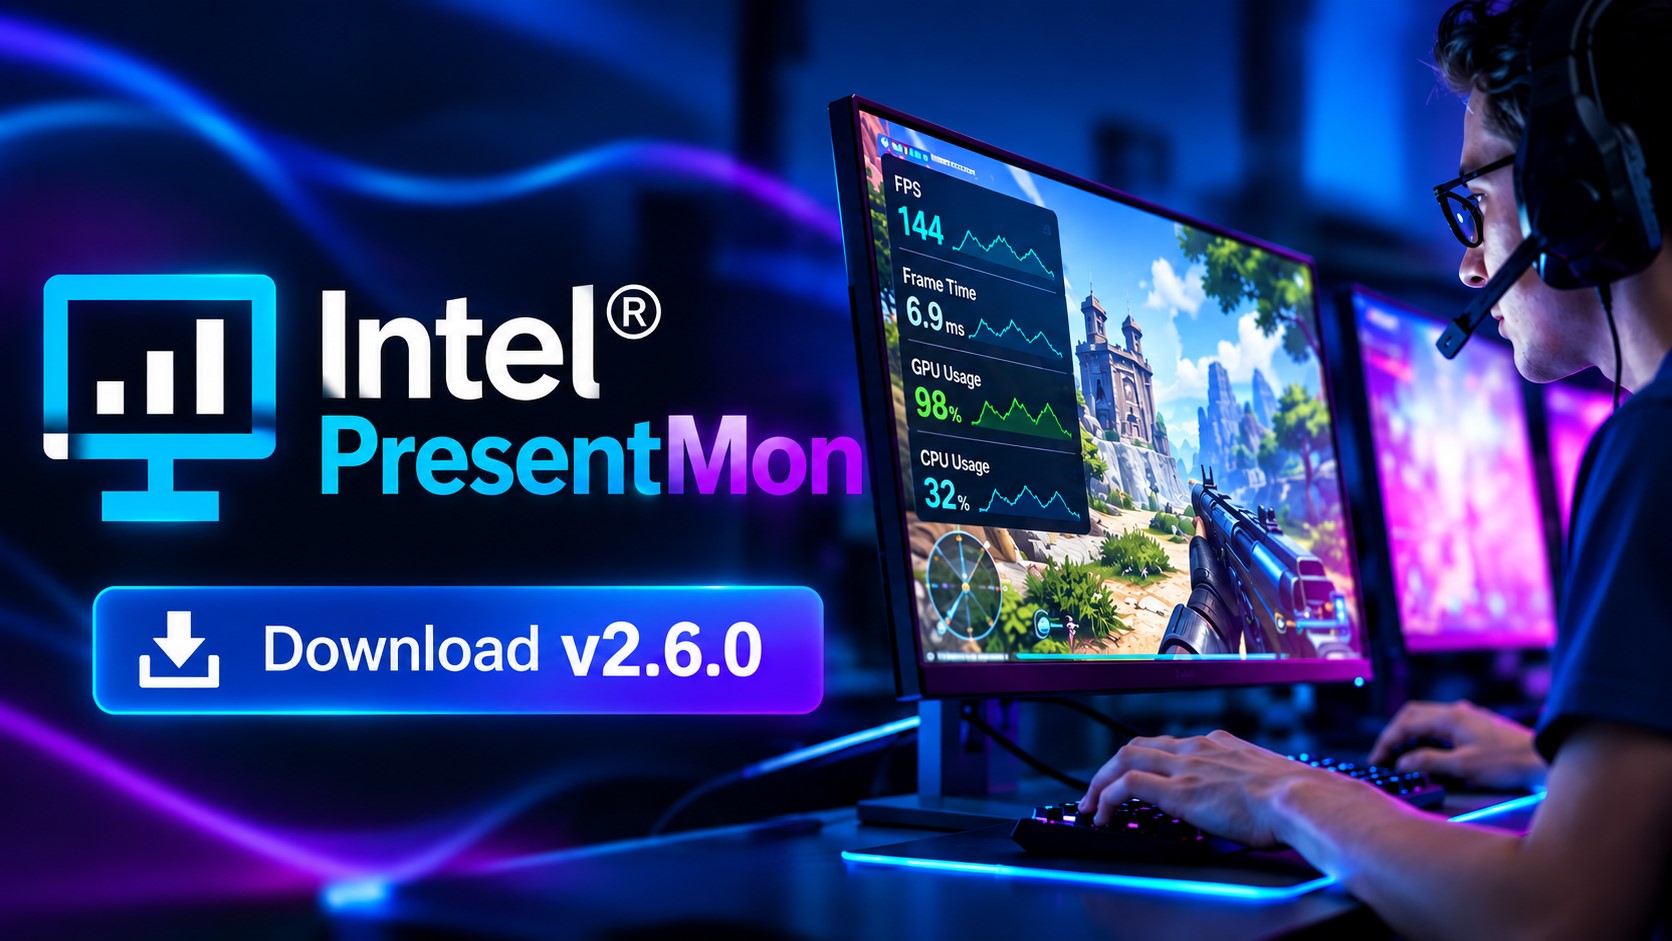
Intel PresentMon 2.6.0 arrives with lower CPU usage, new gaming overlay, and deeper performance metrics
Intel has released PresentMon 2.6.0, the newest version of its free and open-source performance monitoring tool for gamers, developers, reviewers, and hardware testers. The update focuses on making the software lighter, more informative, and better suited for understanding how games actually feel during real-world gameplay.
One of the biggest improvements in PresentMon 2.6.0 is a major reduction in CPU usage. According to Intel, the latest version can cut the tool’s own CPU resource consumption by up to 78%, including on mobile-class systems such as gaming laptops. This matters because performance monitoring software should not noticeably interfere with the results it is measuring.
Intel achieved this by adjusting how PresentMon handles ETW flushing and other background operations. In areas where ultra-precise timing is not required, the software now uses less aggressive timing behavior. Diagnostic log flushing has also been optimized to reduce idle CPU activity, making the app more efficient when running in the background.
Another key addition is the new Game Experience overlay preset. Instead of only showing traditional performance data such as frame rate, the new overlay is designed to highlight metrics that better reflect perceived motion quality and animation smoothness. This should help users understand not just how fast a game is running, but how smooth and consistent it actually looks during play.
That distinction is important for modern PC gaming performance analysis. A game can show a high average FPS while still feeling uneven due to frame pacing issues, stutter, dropped frames, or inconsistent animation delivery. PresentMon 2.6.0 aims to give users more useful visibility into those real-world experience factors.
The update also improves metric availability feedback. If a certain metric cannot be used, it can still appear in the interface but will be clearly marked as unavailable. This makes it easier for users to understand what data is supported on their system and why a particular reading may not be active.
PresentMon 2.6.0 also expands telemetry support by allowing the application to show data from multiple graphics adapters at the same time. This could be useful for systems with integrated and discrete GPUs, hybrid graphics setups, or test environments involving more than one display adapter.
For developers and hardware analysts, Intel has added DirectX 12 Pipeline State Object compilation metrics. These include PSO compilation count, compilation duration, and busy percentage. Such data can help identify shader or pipeline compilation behavior that may contribute to stutter or inconsistent performance in games.
The new version also adds support for newer Windows DDI flip events, completed and dropped flip reporting, and additional display metadata in captured data. These enhancements should make PresentMon more valuable for detailed frame analysis, graphics debugging, and performance testing.
Overall, Intel PresentMon 2.6.0 is a meaningful update for anyone interested in PC gaming performance monitoring. With lower CPU overhead, a more experience-focused overlay, expanded telemetry, and deeper DirectX 12 analysis tools, the software is becoming more useful for both everyday gamers and technical users who want a clearer picture of how games perform beyond average FPS.


